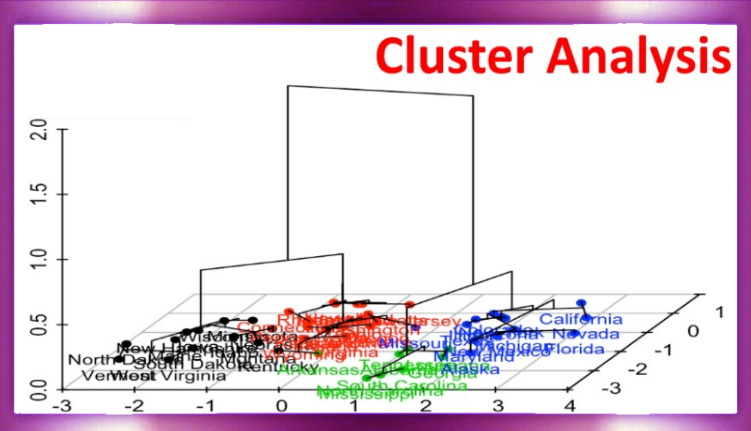
There are a great many methods of cluster analysis, but they all attempt to answer this basic question.
- +49 178 89 55 751
- info@StatistischeBeratung.de
- Mo.-Fr. 17:00 - 18:00


Pearson and Spearman Correlation – Interpretation of Results
Correlation analysis is a fundamental statistical method used to examine relationships between two variables. The most commonly used coefficients are the Pearson correlation coefficient (r) and the Spearman rank correlation coefficient (ρ).
Both coefficients range from -1 to +1, where the sign indicates direction and the magnitude indicates the strength of the relationship (Mukaka, 2012).

Regression Analysis in SPSS – How to Interpret Results
Regression analysis is one of the most widely used statistical methods in scientific research, including bachelor’s, master’s, and doctoral theses. Its main purpose is to examine the relationship between a dependent variable and one or more independent variables.
This guide explains how to interpret regression results in SPSS, focusing on key output tables and their meaning.

Statistical Guides – SPSS, AMOS and Data Analysis
Statistical data analysis is a fundamental component of modern scientific and business research. Without proper application of statistical methods and correct interpretation of results, reliable conclusions cannot be achieved.

Central Limit Theorem and the Use of Parametric and Nonparametric Statistics: Data Normality and Large Sample Requirements
1. Introduction
The Central Limit Theorem (CLT) is a fundamental principle of inferential statistics. It enables the use of parametric statistical tests even when the raw data are not perfectly normally distributed.

Subcategories
Bayessche Statistik Article Count: 2
Bayessche Statistik:
- Bayessche Statistik in der Praxis: a priori und a posteriori
- Bayes'scher T-Test
- Bayessche ANOVA
- Bayessche Regression
SEM - AMOS Article Count: 17
SEM - AMOS
Explorative Faktorenanalyse (EFA) Article Count: 4
Cronbach’s Alpha coefficients Article Count: 2
NVivo - Methods of qualitative analysis - Qualitative research Article Count: 4
NVivo - Methods of qualitative analysis - Qualitative research
One of the key techniques we use at Leonardo Miljko is the nVivo program. This powerful tool allows us to efficiently organize, analyze and interpret large amounts of qualitative data. It allows us to systematically code text, audio and video files and identify patterns and themes. By using nVivo we can visualize complex data structures and draw well-founded conclusions
Kontakt
Statistische Beratung und Datenanalyse Leonardo Miljko gew.
Zum Alten Hofgarten 21,
Zum Alten Hofgarten 21,
DE-94405 Landau an der Isar
Tel./WhatsApp: +49-178-8955-751
Viber/WhatsApp: +387-63-997-996
E-Mail:
WEB:

Protected by RSFirewall! Module